Regression-Based Modeling
Regression is used as a technique for building up forecasting models.
Decisions to be made here include:
1. What would the regression equation look like when we include:
- The trend component (nature of trend, linearity, increasing or decreasing returns)
- The cyclical component (macro state of the economy)
- The seasonal component (seasonal demand for products)
The calibration period is the data that's used to construct the model.
The hold out, or the forecasting period, is where we want to make sure that the model is capturing what's going on so that it's going to be useful for the future.
Thus, we look at our data and divide it into the above two components.
We build the model on the calibration data and then apply it to the forecasting data.
Trend Component
Y = intercept + slope*(week #)
Two ways to carry out regression analysis here:
1. Use the regression tool that is built into the the data analysis tool pack with Excel
2. Type commands directly into Excel cells
=intercept(y_range , x_range)
=slope(y=range, x_range)
Advantage of typing commands over using the data analysis tool pack: Fixed values are not typed. And thus, anytime that the data set is updated, if we change the x and y values, it will automatically change the intercept and slope coefficients.
Forecast is represented by the dashed lines.
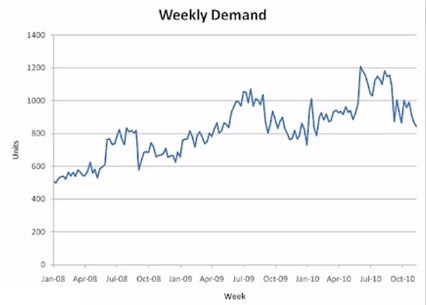
We see that the demand rises around the month of July every year. To figure out what we can do, we should look at the residuals.
In order to assess the linear trend, i.e., see if it’s accurate, we can fit a regression line using the data of the individual years.
We see that the slopes are not equal and that the demand growth is higher/faster in the first year than in the second year.
Thus, while forecasting for 2010, if we forecast using first year’s data, we are going to over predict and if we forecast using the second year’s data, we are going to under predict.
Thus, this is not a linear trend à it is slowing down over time.
To take this into account, one way is as follows:
Y = intercept + slope* ln (week #)
The ln function will account for the slower and slower rate of growth over time.
